
JobTrackerRun every job, from the sale to payday→
Run the work
Get paid and pay people
RankLockerGet found, and see what it brings in→
Get found
Know what's working
For agencies
WeekendCRMAnswer every lead, even on the weekend→
Get the review
Software · JobTracker · Business insights
JobTracker
Business insights
A construction KPI dashboard that tells you what needs you today
Business insights in JobTracker is a construction KPI dashboard and reporting system for home-services and construction owners. It shows open pipeline, job value, revenue and gross profit the moment you log in, ranks plain-English AI findings from your own numbers, emails each PM and the owner an end-of-day report, and puts the day on a live office TV.
Every screen in English and Spanish · Works on phone, tablet and desktop · Plans start at $495 a month
The problem
Sound familiar?
Why do you only learn how the month went after it's over?
Your numbers are scattered across a CRM, a spreadsheet, the accounting software and a few people's heads. Building a report means exporting, pasting and guessing. By the time you see that a job ran over or a crew started late, the week is gone and the money went with it. Every report you build is already old by the time you read it.
So you run the company on gut feel and late-night math. You ask the same questions every morning and get a different answer from each person. You don't need more reports. You need someone to tell you what's going well, what's slipping and what to do about it. In plain English, every morning.
Where it costs you today:
jobs sliding over budget with nobody noticing until closeout
late starts and missed visits you hear about days later
hours spent building reports instead of acting on them
What it does
Lead the company
What does the KPI dashboard in JobTracker do?
The business at a glance
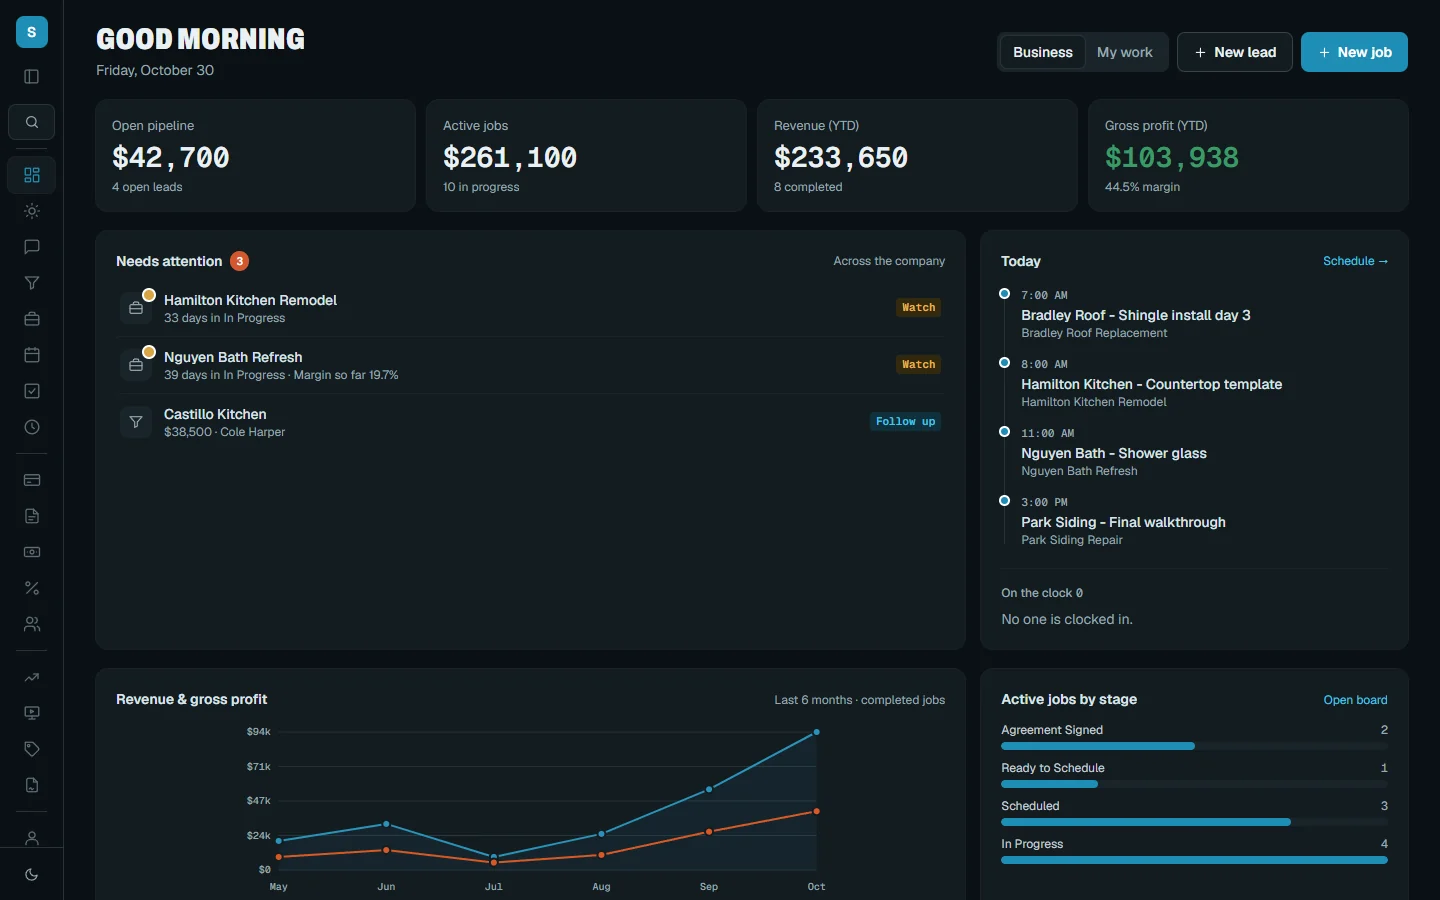
The executive dashboard shows open pipeline, open job value, revenue and gross profit year to date. Jobs needing attention are flagged by delays, overdue tasks, slipping margin and overruns.
AI insights in plain English
Findings are ranked by importance, each with the number behind it, why it matters and what to do. They lead with what's going well, and missing data is never invented.
End-of-day emails for everyone
Each PM gets their own jobs. The owner gets an operations digest with late starts, missed visits, hours, costs and an AI summary, and you can preview it or send yourself a test.
An Insights workspace
Dig into sales, profitability, production, budget, labor, commissions, lead sources, engineering and permits. Export a printable PDF report or a multi-sheet Excel file for your accountant. Answer almost any business question without a spreadsheet.
Office TV wall screens
A live wall screen shows today's and this month's revenue, today's visits, jobs needing attention and a map of clocked-in crew and trucks. Run it in English or Spanish, and hide money on shop screens.
Touchscreen actions on the TV
On a touch TV or tablet, staff work tasks, jobs, today's visits, materials, permits and payables right from the screen. Each change is recorded under that person's Employee PIN. The screen becomes a place to get work done.
In the app
Real screen
See it in JobTracker.
This is the actual screen your team works in, shown here with demo company data.
JobTracker · Business insights
With JobTracker
What changes
What changes when the numbers come to you?
You log in and see open pipeline, revenue and gross profit before your coffee is done.
The AI insight card tells you the top things to do first, with the number behind each one, and it starts with what's going well.
The crew walks past the office TV and sees today's visits, problem jobs and who's clocked in on the map.
At the end of the day, the digest lands in your inbox with late starts, missed visits, hours and costs.
If nothing changes
Every week you run on gut feel is a week of slipping margins and late starts you could have caught. The numbers already exist in your business. Right now, nobody is reading them for you.
The plan
Three steps
How do you get started?
1
Book a demo.
Thirty minutes, on work like yours.
2
We set it up with you.
We bring in your jobs, people and data, and train your crew in English or Spanish.
3
Run your next job in it.
See the difference on day one.
Works with
One system
Part of JobTracker, connected to everything else.
Get paid and pay people
Job costing software →
Run the work
Job management software →
Lead the company
AI assistant for contractors →
See how it all fits together in JobTracker, our job management software for contractors →
FAQ
Straight answers
Questions about business insights.
Do I have to build the reports myself?
No. The dashboard, AI insights and end-of-day emails come ready from your own job data. The Insights workspace covers sales, profitability, production, labor, commissions, lead sources and permits without a spreadsheet. Open it and the answers are already there.
Will the AI make up numbers when data is missing?
No. Every AI finding shows the number behind it, and missing data is never invented. Findings are ranked by importance and explain why each one matters and what to do next. You get facts you can check, not guesses dressed up as advice.
Can I see how operations are running, not just money?
Yes. Production analytics show job health, delays by reason, schedule accuracy, crew utilization, backlog, QC pass rate and daily-log coverage, so you can run operations on facts instead of guesses.
Will the office TV show my margins to the crew?
Only if you want it to. Each screen has its own drag-and-drop layout, and money can be hidden on shop screens. Screens are password protected, work on old smart TVs and recover by themselves. Each screen can run landscape or portrait.
Can I get a second opinion on one job?
Yes. Any job can get its own AI insight, a second opinion on how that job is doing. The job's Financials tab shows budget, costs, profit and cash for the same job. Use it on the jobs that worry you most.
How much does it cost?
Plans start at $495 a month, with a discount when you pay yearly. Book a demo and we'll show you the dashboard and AI insights working on sample jobs. Bring the questions you ask every Monday morning.
Get started
30-minute demo
See what needs your attention today
Book a demo and see the dashboard, AI insights, end-of-day email and office TV working on sample jobs.